📅 Schedule A Meeting:
Financial prices, weather, home energy usage, and even weight are all examples of data that can be collected at regular intervals.
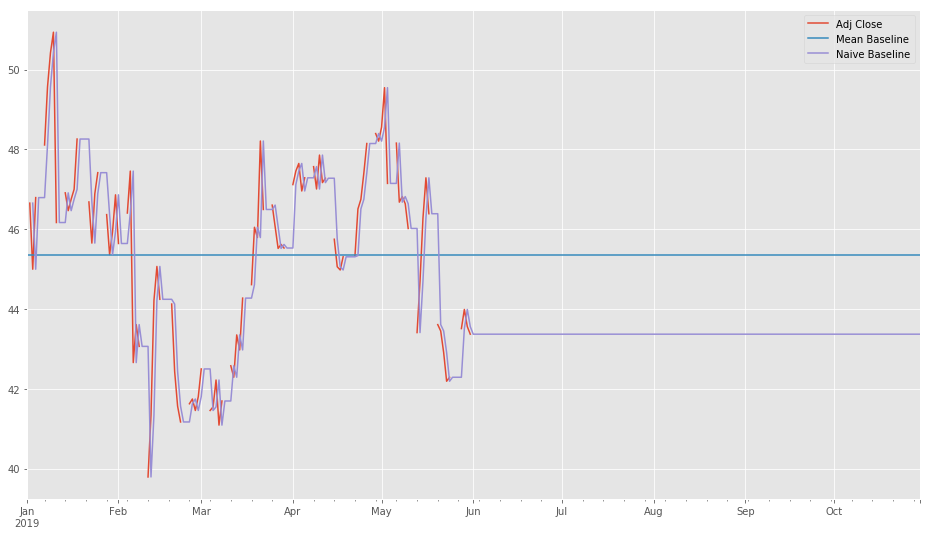
Mean & Naive Baseline Measurements:
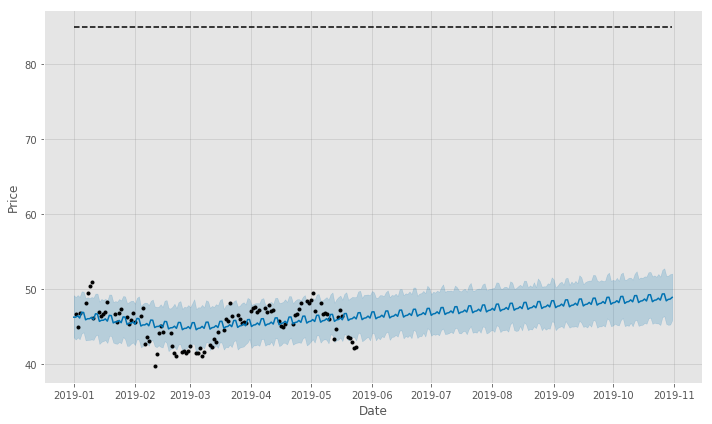
Almost every data scientist will encounter time series in their daily work and learning how to model them is an important skill in the data science toolbox. One powerful yet simple method for analyzing and predicting periodic data is the additive model. The idea is straightforward: represent a time-series as a combination of patterns at different scales such as daily, weekly, seasonally, and yearly, along with an overall trend.
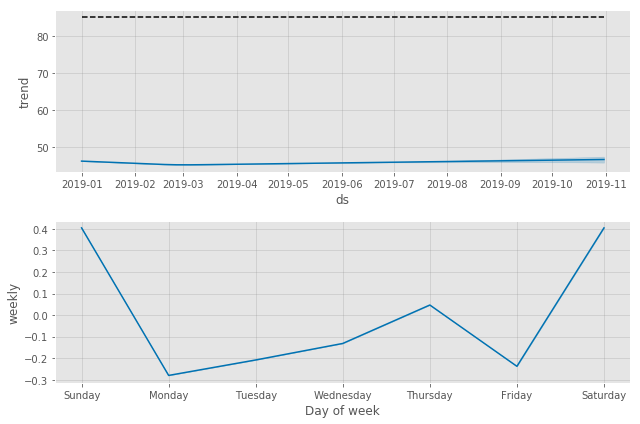
Your energy use might rise in the summer and decrease in the winter, but have an overall decreasing trend as you increase the energy efficiency of your home. An additive model can show us both patterns/trends and make predictions based on these observations.
Adjusted Closing Prices 01/01/2019 to 10/27/2019:
I practiced:
- Forecasting financial data in Python
- Connecting to Yahoo Finance API
- Working with time series data
The entire notebook, including code and comments, can be found here My Colab Notebook.
Make 💰 By Learning Programming:
- Tesla
- Liquid I.V. Hydration Multiplier 30 Stick, 16.93 Ounce
- Xeela Pre workout
- Sour Strips
- Impractical Python Projects
- Designing Data-Intensive Applications
- Python for Data Analysis
- Python for Data Science Handbook
- Hands-On Machine Learning w/Scikit-Learn & Tensorflow