📅 Schedule A Meeting:
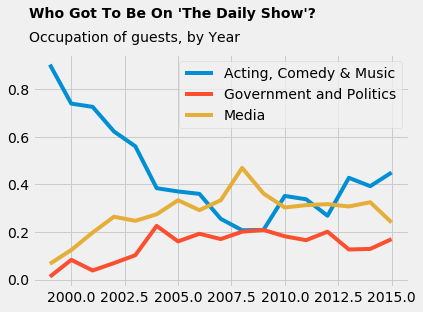
As a learning experience, I recreated this data visualization from FiveThirtyEight’s article, Every Guest Jon Stewart Ever Had On ‘The Daily Show’.
I learned about:
- Exploratory vs Explanatory visualization
- Pandas data wrangling and crosstabs
- Matplotlib, Seaborn, and Pandas plotting
The entire notebook, including code and comments, can be found here My Colab Notebook.
Make 💰 By Learning Programming:
- Tesla
- Liquid I.V. Hydration Multiplier 30 Stick, 16.93 Ounce
- Xeela Pre workout
- Sour Strips
- Impractical Python Projects
- Designing Data-Intensive Applications
- Python for Data Analysis
- Python for Data Science Handbook
- Hands-On Machine Learning w/Scikit-Learn & Tensorflow